성능 모니터링을 위한 Prometheus와 Grafana 배포#
![]() Enterprise 플랜 에서 사용 가능
Enterprise 플랜 에서 사용 가능
![]() Cloud 및 self-hosted 배포
Cloud 및 self-hosted 배포
성능 모니터링 지원을 통해 관리자는 Prometheus 및 Grafana 와의 통합을 통해 대규모 Enterprise 배포의 시스템 상태를 추적할 수 있습니다. 이러한 통합은 여러 Mattermost 서버에서 데이터를 수집할 수 있게 해주며, 특히 Mattermost를 고가용성 모드 로 실행 중인 경우에 유용합니다. 시스템 상태를 추적하기 시작하면 Grafana 대시보드에서 성능 알림을 설정 할 수 있습니다.
관리자는 Prometheus 와 Grafana 를 배포하여 Mattermost 애플리케이션의 다양한 데이터 포인트를 OpenMetrics 형식으로 수집하고 저장할 수 있습니다.
팁
Prometheus와 Grafana를 배포하고 싶지 않으신가요? Mattermost Metrics 플러그인을 사용하여 성능 메트릭을 수집 할 수도 있습니다.
Prometheus 설치#
중요
Prometheus와 Grafana를 Mattermost와 동일한 서버에 설치할 수 있지만, 이러한 통합을 별도의 서버에 설치하고 Prometheus를 구성하여 Mattermost 및 기타 연결된 서버에서 모든 메트릭을 가져오는 것을 권장합니다.
Prometheus 의 사전 컴파일된 바이너리를 다운로드하세요. Darwin, Linux, Windows를 포함한 많은 인기 있는 배포판에 대한 바이너리가 제공됩니다. 설치 지침은 Prometheus 설치 가이드 를 참조하세요.
prometheus.yml이라는 이름의 Prometheus 구성 파일에 다음 설정을 권장합니다:# my global config global: scrape_interval: 60s # By default, scrape targets every 15 seconds. evaluation_interval: 60s # By default, scrape targets every 15 seconds. # scrape_timeout is set to the global default (10s). # Attach these labels to any time series or alerts when communicating with # external systems (federation, remote storage, Alertmanager). external_labels: monitor: 'mattermost-monitor' # Load rules once and periodically evaluate them according to the global 'evaluation_interval'. rule_files: # - "first.rules" # - "second.rules" # A scrape configuration containing exactly one endpoint to scrape: # Here it's Prometheus itself. scrape_configs: # The job name is added as a label `job=<job_name>` to any timeseries scraped from this config. - job_name: 'prometheus' # Override the global default and scrape targets from this job every five seconds. # scrape_interval: 5s # metrics_path defaults to '/metrics' # scheme defaults to 'http'. static_configs: - targets: ["<hostname1>:<port>", "<hostname2>:<port>"]
데이터를 수집하기 위해
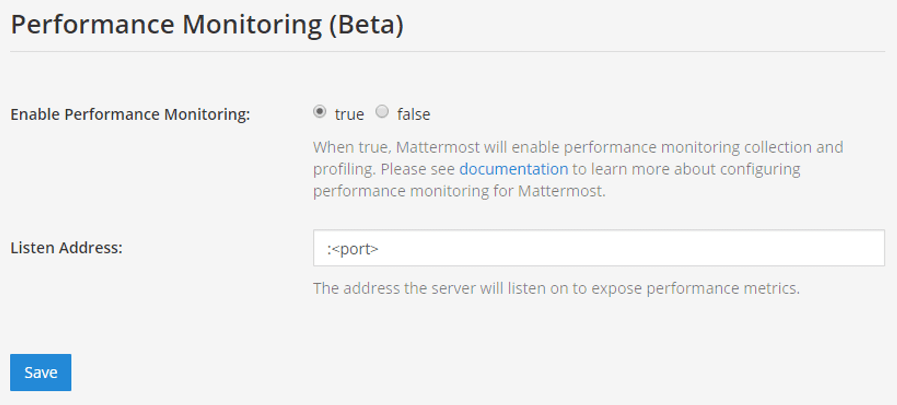
<hostname1>:<port>매개변수를 Mattermost 호스트 IP 주소와 포트로 대체하세요. HTTP를 사용하여/metrics에 연결합니다.Mattermost System Console에서 Environment > Performance Monitoring 으로 이동하여 Enable Performance Monitoring 을 true 로 설정한 다음 Listen Address 를 지정하고 Save 를 선택하세요. 자세한 내용은 Configuration Settings 문서를 참조하세요.
서버가 실행 중인지 테스트하려면
<ip>:<port>/metrics로 이동하세요.
참고
HTTP를 사용하여 /metrics 에 연결하려면 Mattermost Enterprise 라이선스가 필요합니다.
마지막으로
vi prometheus.yml을 실행하여 Prometheus 구성을 완료하세요. Prometheus 서비스를 시작하려면 Prometheus에서 제공하는 종합 가이드 를 참조하세요.서비스가 시작되면
<localhost>:<port>/graph에서 데이터에 접근할 수 있습니다. Prometheus 서비스를 사용하여 그래프를 생성할 수 있지만, 여기서는 Grafana에서 메트릭 및 분석 대시보드 생성에 중점을 두겠습니다.
팁
문제 해결 방법은 Prometheus FAQ 페이지 를 참조하세요.
Grafana 설치#
중요
Prometheus와 Grafana를 Mattermost와 동일한 서버에 설치할 수 있지만, 이러한 통합을 별도의 서버에 설치하고 Prometheus를 구성하여 Mattermost 및 기타 연결된 서버에서 모든 메트릭을 가져오는 것을 권장합니다.
Ubuntu 또는 Debian에서 Grafana 사전 컴파일된 바이너리 를 다운로드하세요. Redhat, Windows 및 Mac을 포함한 다른 배포판에서도 바이너리를 사용할 수 있습니다. 설치 지침은 Grafana 설치 가이드 를 참조하세요.
Grafana 패키지는 서비스로 설치되므로 서버를 쉽게 시작할 수 있습니다. 자세한 내용은 설치 가이드 를 참조하세요.
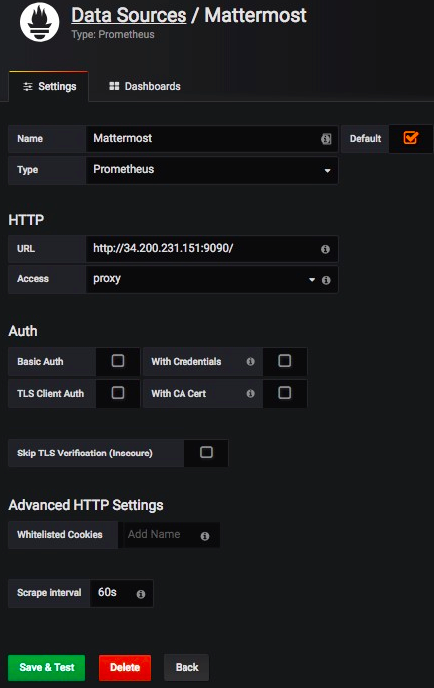
기본 HTTP 포트는
3000이며 기본 사용자 이름과 비밀번호는admin입니다.아래 스크린샷에 정의된 대로 다음 설정으로 Mattermost 데이터 소스를 추가하세요
팁
문제 해결 방법은 Grafana 문제 해결 페이지 를 참조하세요.
사용자 가이드와 튜토리얼은 Grafana 문서 를 참조하세요.
시작하기#
시작하는 데 도움이 되도록 Grafana에서 공유된 세 가지 샘플 대시보드를 다운로드할 수 있습니다:
팁
UI나 HTTP API에서 Grafana 대시보드를 가져오는 방법은 이 Grafana 가이드 를 참조하세요.
Mattermost 성능 모니터링 v2 는 애플리케이션, 클러스터, 작업 서버 및 시스템 메트릭을 포함한 성능 모니터링을 위한 상세 차트를 포함합니다.
Mattermost 알림 상태 모니터링 은 Mattermost에서 전송된 다양한 유형의 알림을 추적하는 데 사용할 수 있습니다. Mattermost 알림 상태 모니터링에 접근하고 활성화하려면 기능 플래그
NotificationMonitoring을true로 설정해야 합니다. 시스템 관리자는 System Console을 통해 알림 모니터링 데이터 수집을 비활성화 할 수 있습니다.Mattermost 웹 앱 성능 메트릭 은 웹 바이탈과 Mattermost 특정 메트릭을 포함한 클라이언트 측 성능에 대한 상세 메트릭을 포함합니다.
Mattermost 모바일 앱 성능 메트릭 은 웹 바이탈과 Mattermost 특정 메트릭을 포함한 클라이언트 측 모바일 성능에 대한 상세 메트릭을 포함합니다.
Mattermost 스레드 토론 메트릭 은 스레드 토론 기능에 관련된 쿼리에 대한 상세 메트릭을 포함합니다.
Mattermost 성능 KPI 메트릭 은 성능과 시스템 상태를 모니터링하기 위한 주요 메트릭을 포함합니다.
Mattermost 성능 모니터링 (추가 메트릭) 은 전송된 이메일이나 업로드된 파일과 같은 추가 메트릭을 포함하며, 일부 배포에서 모니터링하는 것이 중요할 수 있습니다.
수집되는 항목은 무엇인가요?#
Mattermost는 시스템 성능을 모니터링하는 데 사용할 수 있는 사용자 정의 메트릭 과 표준 Go 메트릭 을 제공합니다.