성능 모니터링 메트릭#
![]() Enterprise 플랜 에서 이용 가능
Enterprise 플랜 에서 이용 가능
Mattermost는 Prometheus 및 Grafana와 통합할 수 있는 다음과 같은 성능 모니터링 통계를 제공합니다.
사용자 정의 Mattermost 메트릭#
시스템 성능을 모니터링하는 데 사용할 수 있는 사용자 정의 Mattermost 메트릭 목록은 다음과 같습니다:
API 메트릭#
mattermost_api_time: 주어진 API 핸들러를 실행하는 데 걸리는 총 시간(초)
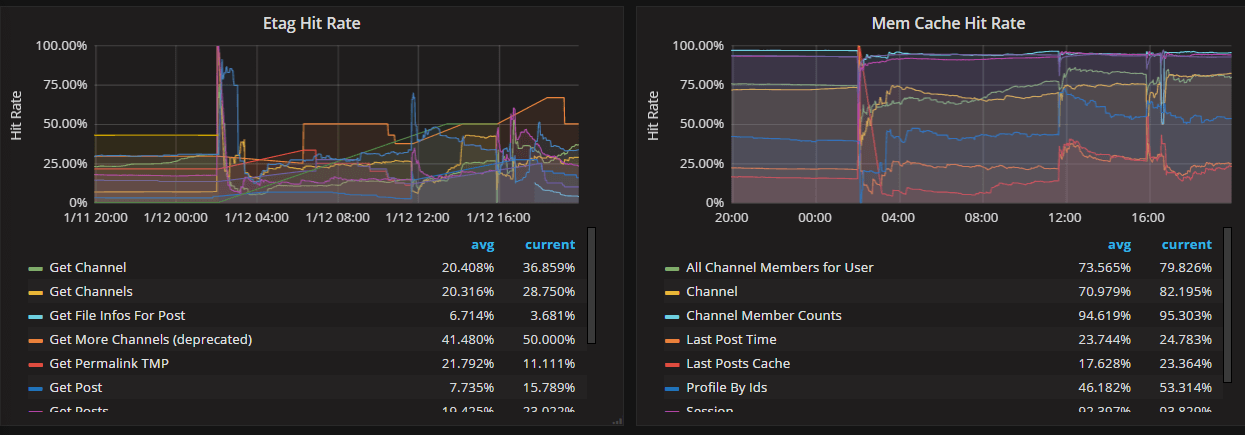
캐싱 메트릭#
mattermost_cache_etag_hit_total: 특정 캐시에 대한 ETag 캐시 히트 총 횟수mattermost_cache_etag_miss_total: API 호출에 대한 ETag 캐시 미스 총 횟수mattermost_cache_mem_hit_total: 특정 캐시에 대한 메모리 캐시 히트 총 횟수mattermost_cache_mem_invalidation_total: 특정 캐시에 대한 메모리 캐시 무효화 총 횟수mattermost_cache_mem_miss_total: 특정 캐시에 대한 캐시 미스 총 횟수
위 메트릭을 사용하여 시간에 따른 ETag 및 메모리 캐시 히트율을 계산할 수 있습니다.
클러스터 메트릭#
mattermost_cluster_cluster_request_duration_seconds: 노드 간 클러스터 요청의 총 지속 시간(초)mattermost_cluster_cluster_health_score: gossip 프로토콜의 소프트 실시간 요구사항을 얼마나 잘 충족하는지 보여주는 점수mattermost_cluster_cluster_requests_total: 노드 간 요청의 총 횟수mattermost_cluster_cluster_event_type_totals: 모든 유형에 대해 전송된 클러스터 요청의 총 횟수
데이터베이스 메트릭#
mattermost_db_active_users: 활성 사용자의 총 수mattermost_db_cache_time: 캐시 핸들러 실행 시간mattermost_db_master_connections_total: 마스터 데이터베이스에 대한 연결의 총 수mattermost_db_read_replica_connections_total: 모든 읽기 복제 데이터베이스에 대한 연결의 총 수mattermost_db_search_replica_connections_total: 모든 검색 복제 데이터베이스에 대한 연결의 총 수mattermost_db_store_time: 주어진 데이터베이스 저장 메서드 실행의 총 시간(초)mattermost_db_replica_lag_abs: 바이너리 로그 거리/트랜잭션 큐 길이를 기반으로 한 절대 지연 시간mattermost_db_replica_lag_time: 복제본이 따라잡는 데 걸리는 시간
데이터베이스 연결 메트릭#
go_sql_max_open_connections: 데이터베이스에 대한 최대 열린 연결 수go_sql_open_connections: 사용 중이거나 유휴 상태인 설정된 연결의 수go_sql_in_use_connections: 현재 사용 중인 연결의 수go_sql_idle_connections: 유휴 상태인 연결의 수go_sql_wait_count_total: 대기한 연결의 총 수go_sql_wait_duration_seconds_total: 새 연결을 기다리는 동안 차단된 총 시간go_sql_max_idle_closed_total: SetMaxIdleConns로 인해 닫힌 연결의 총 수go_sql_max_idle_time_closed_total: SetConnMaxIdleTime으로 인해 닫힌 연결의 총 수go_sql_max_lifetime_closed_total: SetConnMaxLifetime으로 인해 닫힌 연결의 총 수
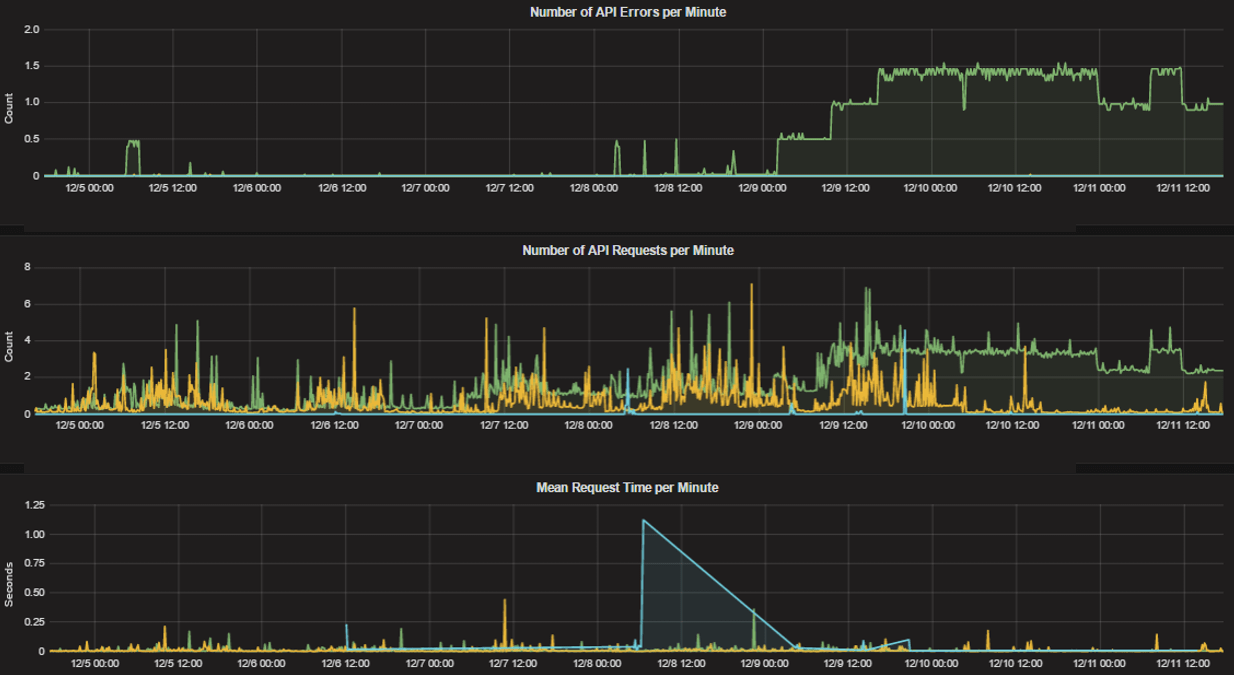
HTTP 메트릭#
mattermost_http_errors_total: HTTP API 오류의 총 수mattermost_http_requests_total: HTTP API 요청의 총 수mattermost_http_websockets_total: 이 서버에 대한 웹소켓 연결의 총 수
참고
Mattermost 버전 v9.9부터 이 값에는 잠재적으로 인증되지 않은 연결이 포함됩니다. 또한 이 메트릭에는 다양한 클라이언트 유형(웹, 모바일, 데스크톱)의 연결 분포를 확인하는 데 사용할 수 있는 origin_client 레이블이 포함됩니다.
로그인 및 세션 메트릭#
mattermost_login_logins_fail_total: 실패한 로그인의 총 수mattermost_login_logins_total: 성공한 로그인의 총 수
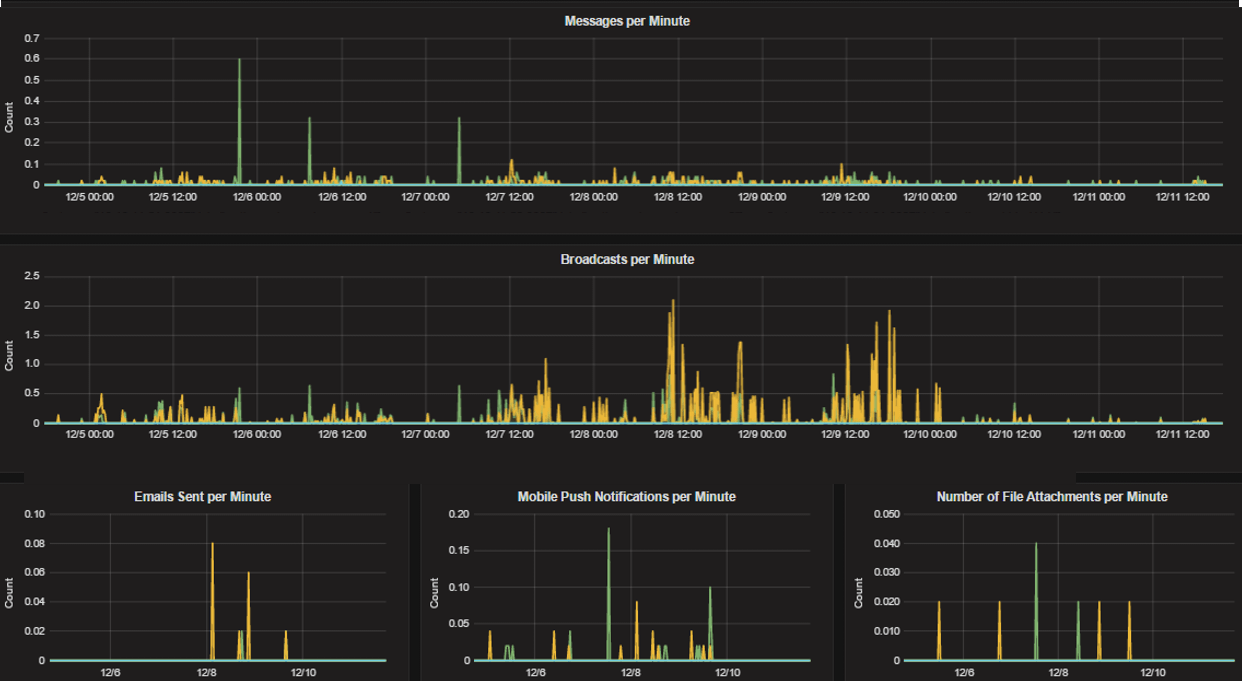
Mattermost 채널 메트릭#
mattermost_post_broadcasts_total: 게시물이 생성되어 전송된 웹소켓 브로드캐스트의 총 수mattermost_post_emails_sent_total: 게시물이 생성되어 전송된 이메일의 총 수mattermost_post_file_attachments_total: 게시물이 생성되어 생성된 파일 첨부의 총 수mattermost_post_pushes_sent_total: 게시물이 생성되어 전송된 모바일 푸시 알림의 총 수mattermost_post_total: 생성된 게시물의 총 수mattermost_post_webhooks_total: 생성된 웹훅 게시물의 총 수
프로세스 메트릭#
mattermost_process_cpu_seconds_total: 사용자 및 시스템 CPU 시간의 총 소요 시간(초)mattermost_process_max_fds: 열린 파일 디스크립터의 최대 수mattermost_process_open_fds: 열린 파일 디스크립터의 수mattermost_process_resident_memory_bytes: 상주 메모리 크기(바이트)mattermost_process_start_time_seconds: 유닉스 에포크 이후 프로세스 시작 시간(초)mattermost_process_virtual_memory_bytes: 가상 메모리 크기(바이트)mattermost_process_virtual_memory_max_bytes: 사용 가능한 가상 메모리의 최대 크기(바이트)
검색 메트릭#
mattermost_search_posts_searches_duration_seconds: 게시물 검색의 총 소요 시간(초)mattermost_search_channel_index_total: 수행된 채널 인덱스의 총 수mattermost_search_file_index_total: 수행된 파일 인덱스의 총 수mattermost_search_files_searches_duration_seconds: 파일 검색의 총 소요 시간(초)mattermost_search_files_searches_total: 수행된 파일 검색의 총 수mattermost_search_post_index_total: 수행된 게시물 인덱스의 총 수mattermost_search_posts_searches_total: 수행된 게시물 검색의 총 수mattermost_search_user_index_total: 수행된 사용자 인덱스의 총 수
WebSocket 메트릭#
mattermost_websocket_broadcast_buffer_size: 처리 대기 중인 websocket 브로드캐스트 버퍼의 이벤트 수mattermost_websocket_broadcast_buffer_users_registered: 브로드캐스트 버퍼 허브에 등록된 사용자 수mattermost_websocket_broadcasts_total: 모든 유형에 대해 전송된 websocket 브로드캐스트의 총 수mattermost_websocket_event_total: websocket 이벤트의 총 수mattermost_websocket_reconnects_total: websocket 재연결 시도의 총 수
로깅 메트릭#
mattermost_logging_logger_queue_used: 로그 대상 큐의 레코드 수mattermost_logging_logger_logged_total: 로깅된 레코드의 총 수mattermost_logging_logger_error_total: 로거 오류의 총 수mattermost_logging_logger_dropped_total: 삭제된 로그 레코드의 총 수mattermost_logging_logger_blocked_total: 차단/지연된 로그 레코드의 총 수
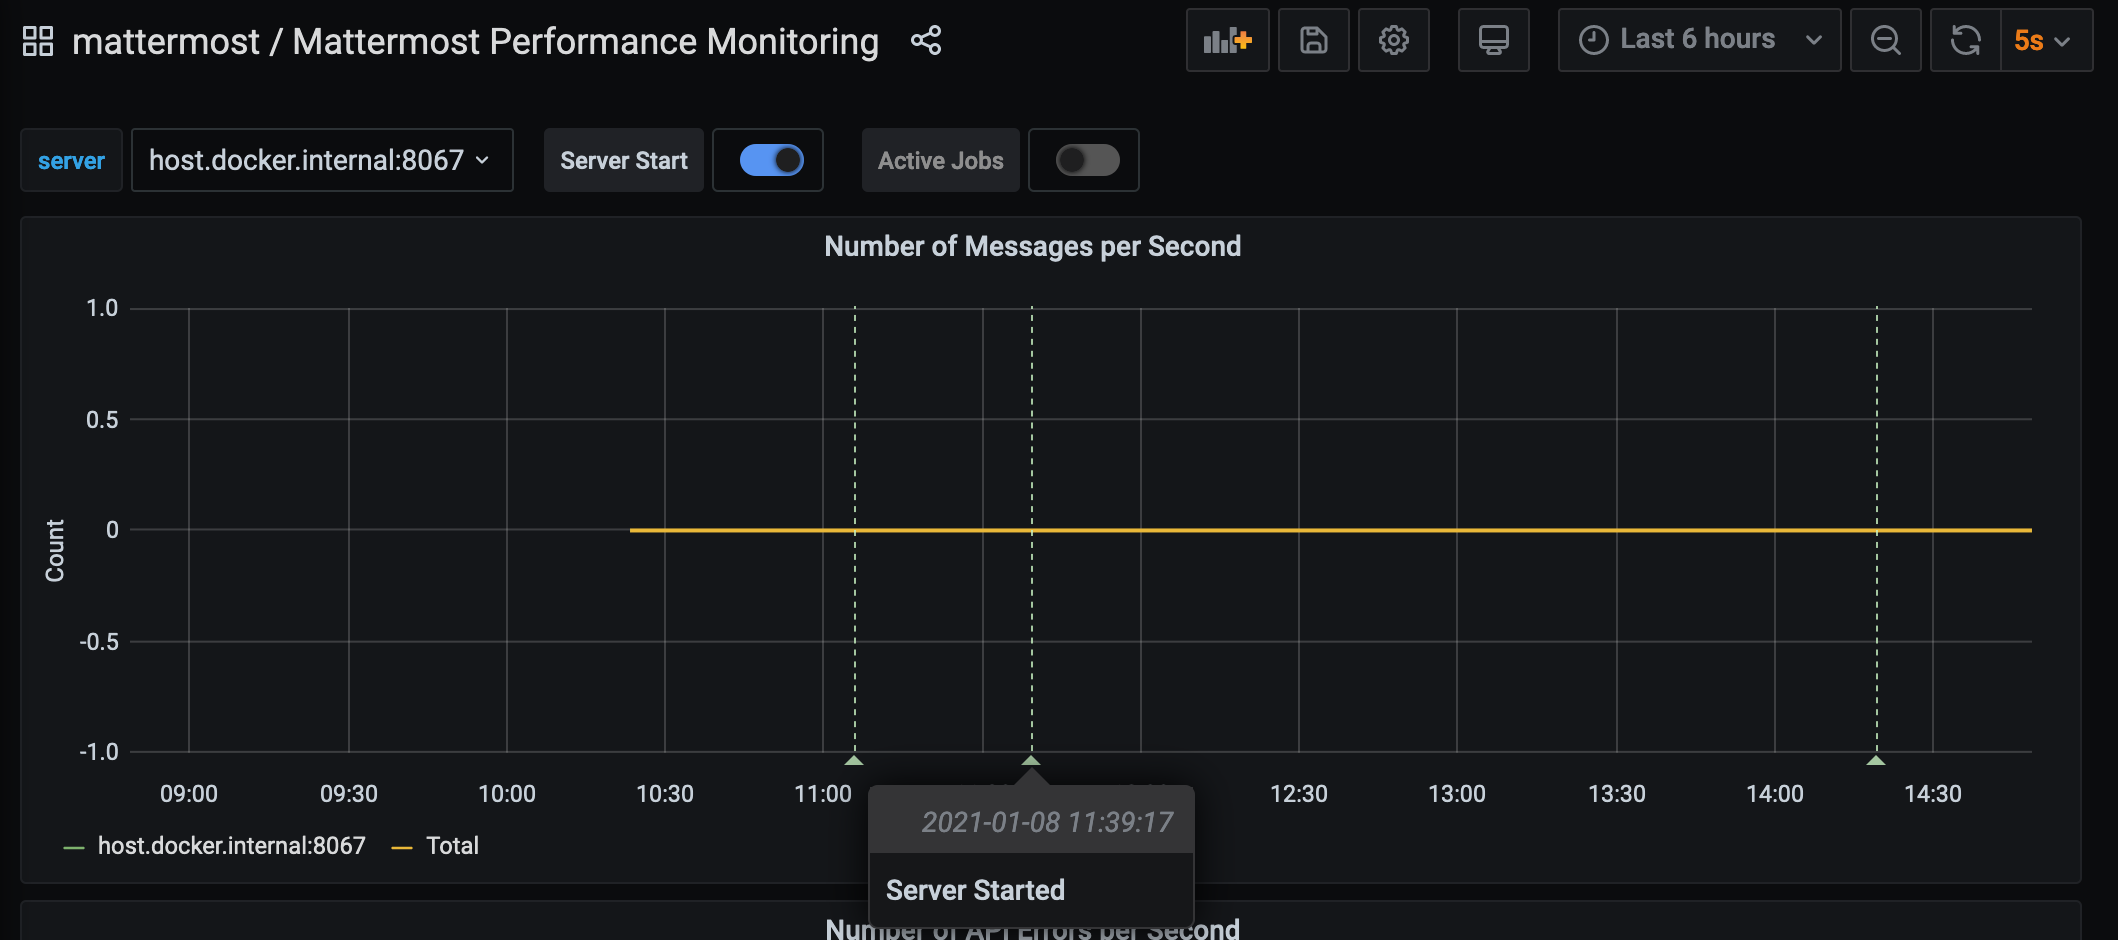
디버깅 메트릭 - 시스템#
mattermost_system_server_start_time: 서버가 시작된 시간
mattermost_system_server_start_time 를 사용하여 해당 이벤트에 대한 주석을 동적으로 추가합니다.
디버깅 메트릭 - 작업#
mattermost_jobs_active: 활성 작업 수
mattermost_jobs_active 를 사용하여 활성 작업 차트를 표시합니다.
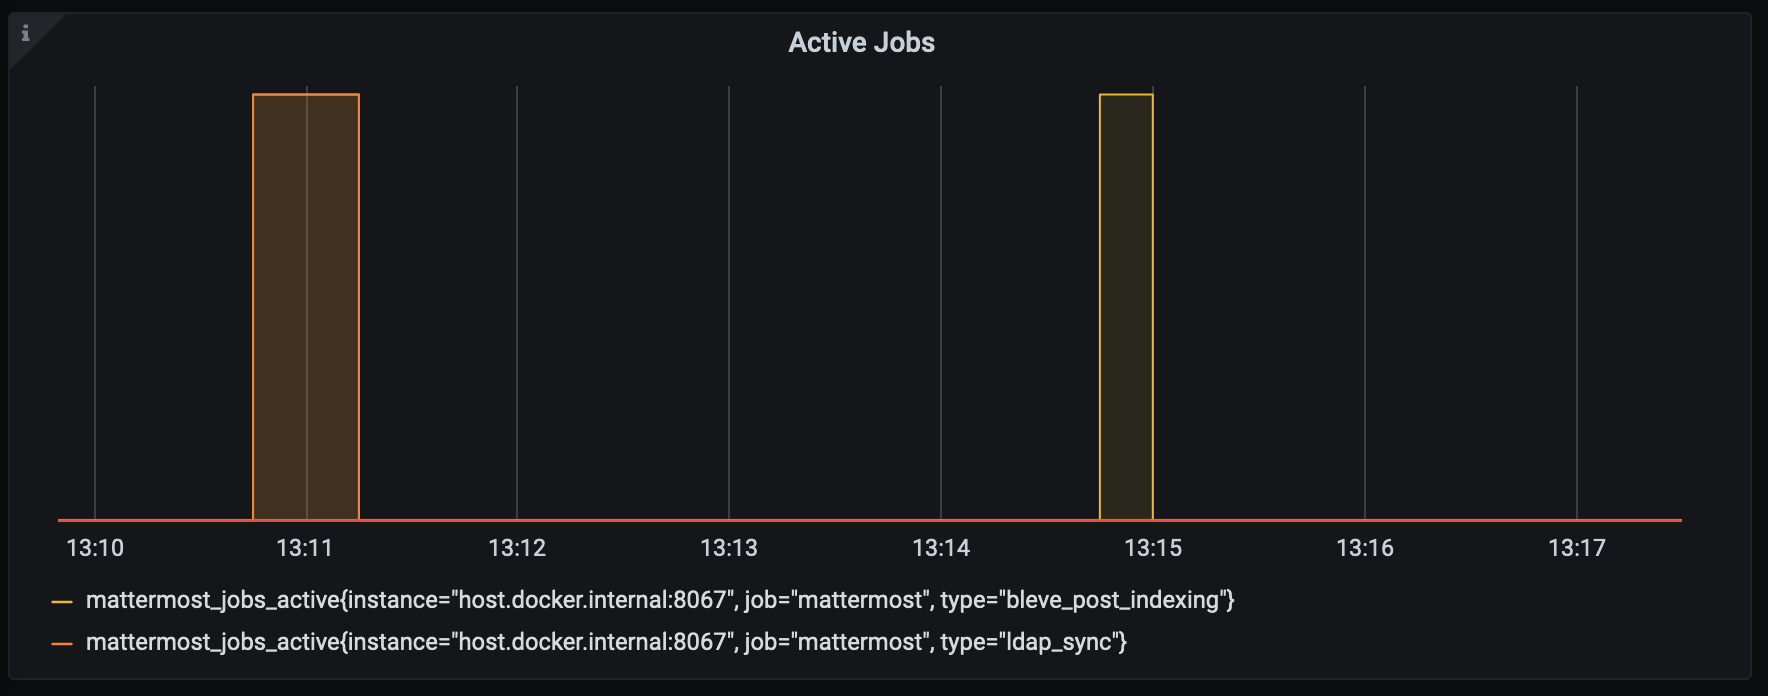
또는 mattermost_jobs_active 를 사용하여 활성 작업에 해당하는 범위 주석을 동적으로 추가합니다.
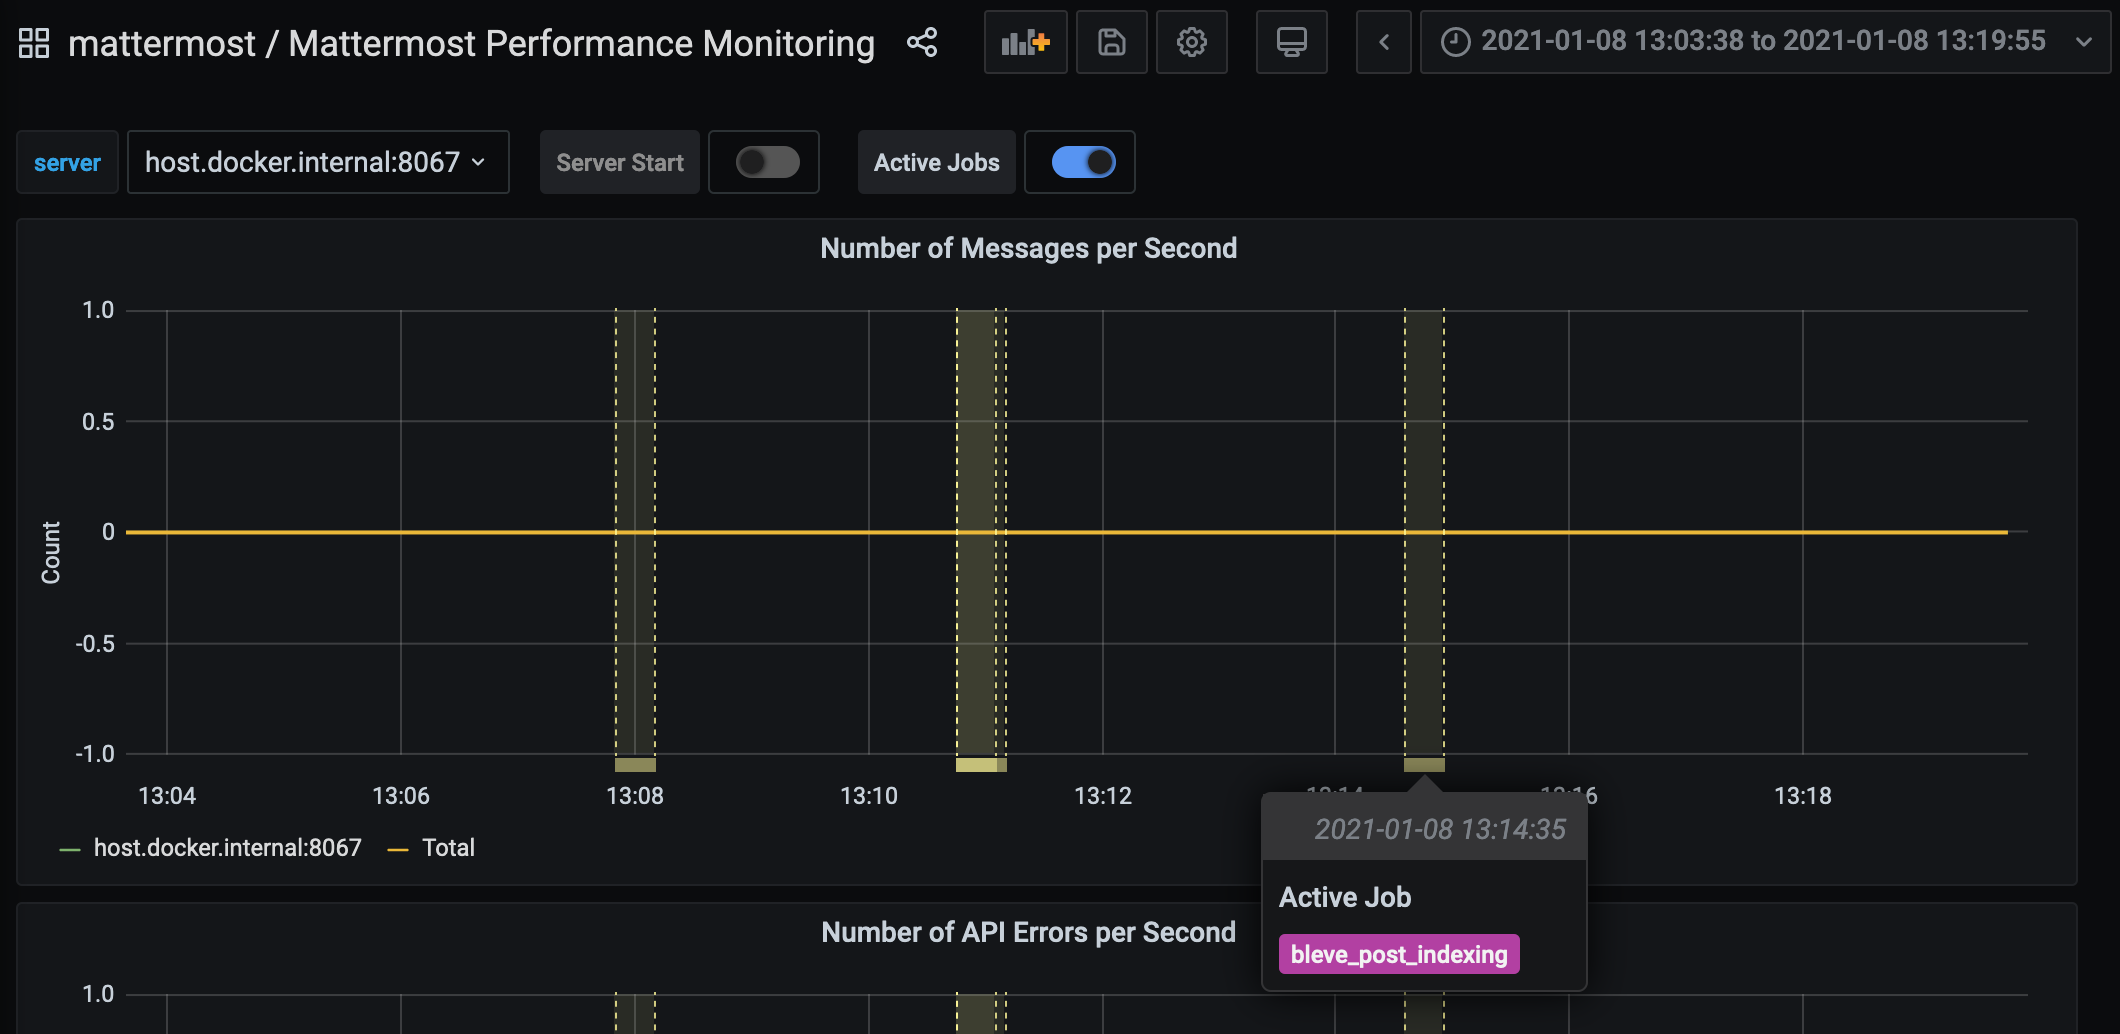
LDAP 동기화 작업과 같이 작업이 장시간 실행될 때 주석을 사용하여 분석을 효율적으로 수행합니다.
참고
실행 시간이 Prometheus 폴링 간격보다 짧은 작업은 Grafana가 원시 Prometheus 시계열 데이터에 대해 범위 쿼리를 수행하고 값이 변경될 때마다 이벤트를 렌더링하기 때문에 보이지 않을 가능성이 높습니다.
플러그인 메트릭#
mattermost_plugin_api_time: 플러그인 API 핸들러 실행 시간(초)mattermost_plugin_hook_time: 플러그인 훅 핸들러 실행 시간(초)mattermost_plugin_multi_hook_server_time: 서버가 여러 플러그인 훅 핸들러를 실행하는 시간(초)mattermost_plugin_multi_hook_time: 여러 플러그인 훅 핸들러를 실행하는 시간(초)
원격 클러스터 메트릭#
mattermost_remote_cluster_clock_skew: 클러스터 간 시계 오차의 근사값mattermost_remote_cluster_conn_state_change_total: 연결 상태 변경 총 횟수mattermost_remote_cluster_msg_errors_total: 메시지 오류 총 횟수mattermost_remote_cluster_msg_received_total: 원격 클러스터에서 수신한 메시지 총 수mattermost_remote_cluster_msg_sent_total: 원격 클러스터로 전송된 메시지 총 수mattermost_remote_cluster_ping_time: 원격 클러스터로의 ping 왕복 시간
알림 메트릭#
mattermost_notifications_error: 알림 흐름을 중단시키는 오류 총 횟수mattermost_notifications_not_sent: 시스템이 의도적으로 전송하지 않은 알림 총 횟수mattermost_notifications_success: 성공적으로 전송된 알림 총 횟수mattermost_notifications_total: 알림 이벤트 총 횟수mattermost_notifications_total_ack: 확인된 알림 이벤트 총 횟수mattermost_notifications_unsupported: 지원되지 않는 앱 버전으로 인한 추적 불가능한 알림 총 횟수
모바일 앱 메트릭#
mattermost_mobileapp_mobile_channel_switch: 사용자가 채널 이름을 클릭한 시점부터 전체 채널 화면이 로드될 때까지 소요된 시간(초)mattermost_mobileapp_mobile_load: 사용자가 앱을 열고 앱이 모든 관련 정보를 최종적으로 로드할 때까지 소요된 시간(초)mattermost_mobileapp_mobile_team_switch: 사용자가 팀을 클릭한 시점부터 전체 카테고리 화면이 로드될 때까지 소요된 시간(초)
웹 앱 메트릭#
mattermost_webapp_channel_switch: 사용자가 LHS에서 채널을 클릭한 시점부터 해당 채널의 게시물이 표시될 때까지 소요된 시간(초)mattermost_webapp_cumulative_layout_shift: 페이지 콘텐츠가 예기치 않게 이동하는 정도 측정mattermost_webapp_first_contentful_paint: 사용자에게 화면에 콘텐츠가 표시되는 데 걸리는 시간(초)mattermost_webapp_global_threads_load: 사용자가 LHS에서 Threads를 열기 위해 클릭한 시점부터 글로벌 스레드 보기가 표시될 때까지 소요된 시간(밀리초)mattermost_webapp_interaction_to_next_paint: 사용자가 마우스 클릭, 터치스크린 탭 또는 키보드 키 누르기의 효과를 보는 데 걸리는 시간 측정(초)mattermost_webapp_largest_contentful_paint: 사용자에게 화면에 큰 콘텐츠가 표시되는 데 걸리는 시간(초)mattermost_webapp_long_tasks: 단일 작업으로 인해 브라우저의 메인 UI 스레드가 50ms 이상 차단된 횟수mattermost_webapp_page_load: 브라우저가 웹 앱 로드를 시작한 시점부터 웹 앱의 로드 이벤트가 완료될 때까지 소요된 시간(초)mattermost_webapp_rhs_load: 사용자가 RHS에서 스레드를 열기 위해 클릭한 시점부터 해당 스레드의 게시물이 표시될 때까지 소요된 시간(초)mattermost_webapp_team_switch: 사용자가 LHS에서 팀을 클릭한 시점부터 해당 팀의 게시물이 표시될 때까지 소요된 시간(초)mattermost_webapp_time_to_first_byte: 브라우저가 서버에서 페이지를 요청하기 시작한 시점부터 응답으로 데이터 수신을 시작할 때까지 소요된 시간(초)
표준 Go 메트릭#
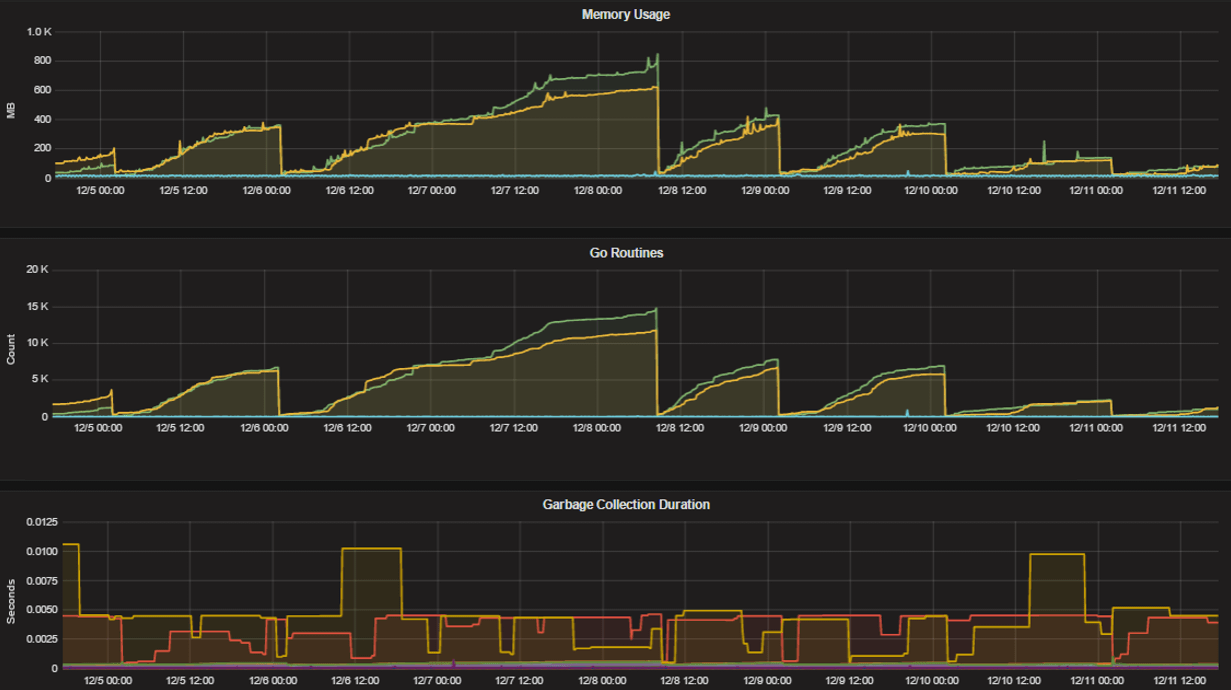
성능 모니터링 기능은 HTTP 서버 런타임 프로파일링 데이터 및 시스템 모니터링을 위한 표준 Go 메트릭을 제공합니다. 예를 들면:
메모리 사용량을 위한
go_memstats_alloc_bytes고루틴 수를 위한
go_goroutines가비지 컬렉션 지속 시간을 위한
go_gc_duration_seconds힙의 객체 추적을 위한
go_memstats_heap_objects
런타임 프로파일링 설정 방법을 알아보려면 pprof 패키지 Go 문서 를 참조하세요. 설명이 포함된 메트릭의 전체 목록은 ip:port 페이지에서도 확인할 수 있습니다.
참고
HTTP를 사용하여 /metrics 에 연결하려면 Mattermost Enterprise 라이선스가 필요합니다.
활성화된 경우 다음 명령으로 프로파일러를 실행할 수 있습니다
go tool pprof http://localhost:<port>/debug/pprof/profile?seconds=<duration>
여기서 localhost 를 서버 이름으로 대체할 수 있습니다. 프로파일링 보고서는 <ip>:<port> 에서 확인할 수 있으며, 여기에는 다음이 포함됩니다:
CPU 프로파일링을 위한
/debug/pprof/profile?seconds=30명령줄 프로파일링을 위한
/debug/pprof/cmdline심볼 프로파일링을 위한
/debug/pprof/symbol트레이스 프로파일링을 위한
/debug/pprof/traceGo 루틴 프로파일링을 위한
/debug/pprof/goroutine힙 프로파일링을 위한
/debug/pprof/heap스레드 프로파일링을 위한
/debug/pprof/threadcreate블록 프로파일링을 위한
/debug/pprof/block과거 메모리 할당을 위한
/debug/pprof/allocs경합 중인 뮤텍스 보유자의 로그를 위한
/debug/pprof/mutex
자주 묻는 질문#
차트 레이블을 구분하기 어려운 이유는 무엇인가요?#
서버 필터와 범례에 사용되는 차트 레이블은 기계의 호스트 이름을 기반으로 합니다. 호스트 이름이 유사하면 레이블을 구분하기 어려울 수 있습니다.
기계에 대해 더 설명적인 호스트 이름을 설정하거나 Prometheus 구성 의 relabel_config 를 사용하여 표시 이름을 변경할 수 있습니다.